Plot a processed signal from Arduino COM Port in real-time is a useful practise when working with sensors, especially for debugging and developing.
In this tutorial, I am going to explain one simple solution with free software like RealTerm and KST. This avoids the need for writing a custom script, which is time-consuming, especially if you never did one.
could be the smarter solution to work with sensors.
Why Plot real-time data from Arduino’s Serial Port?
Simply & fast: Because the serial monitor of Arduino is a *shit*.
If you arrived to here, I think I don’t have to convince you that debugging with the serial monitor… is not nice, right?
How many hours of my life I spent starring at this serial monitor window with encrypted data!!!

Arduino Code-Debugging
Many of us only use single delays and Serial.println( ) to figure out what is happening on the board.
For Shows or Demos
Also, this makes a great feature to present or show your project to others.
Let’s start!
This tutorial is split into two parts:
2. Plotting the data stored in this CSV file on the real-time plotter kst
Contents
1- Write the data from Arduino Serial COM Port into a CSV File
To save the data coming from the COM port into a CSV file (comma separated value), I used the software realTerm. It is free to download.
RealTerm is a Serial/TCP Terminal, similar to Putty (in Windows), but with extended options. There are other programs that allow you to do this, but I found this one “easier”.
This step could be done better writting directly a customized python script… but if we want a quick and useful solution, this should be enough!!

1. Install realTerm
2. Configure it to see the Arduino serial commands
Important Note: that you can not have 2 serial connections opened at the same time. For example, if you are using the Arduino IDE Serial monitor, you are not allowed to open Putty or Realterm and vice-versa. Only one client can be connected at one time. Therefore, if you want to load an Arduino program into the board, you have to deactivate the connection with Realterm and vice-versa.
Configure the COM port that you are using with the Arduino.
This can be seen at Tools>> Serial Boards. In RealTerm on the tab of “Echo Port”. There, we can manage and change the serial port.
Remember that before start reading the data and writing into the selected file, you have to check the box “Monitor” on the “Echo Port” tab. After the change, don’t forget to push the button“Change” to save.

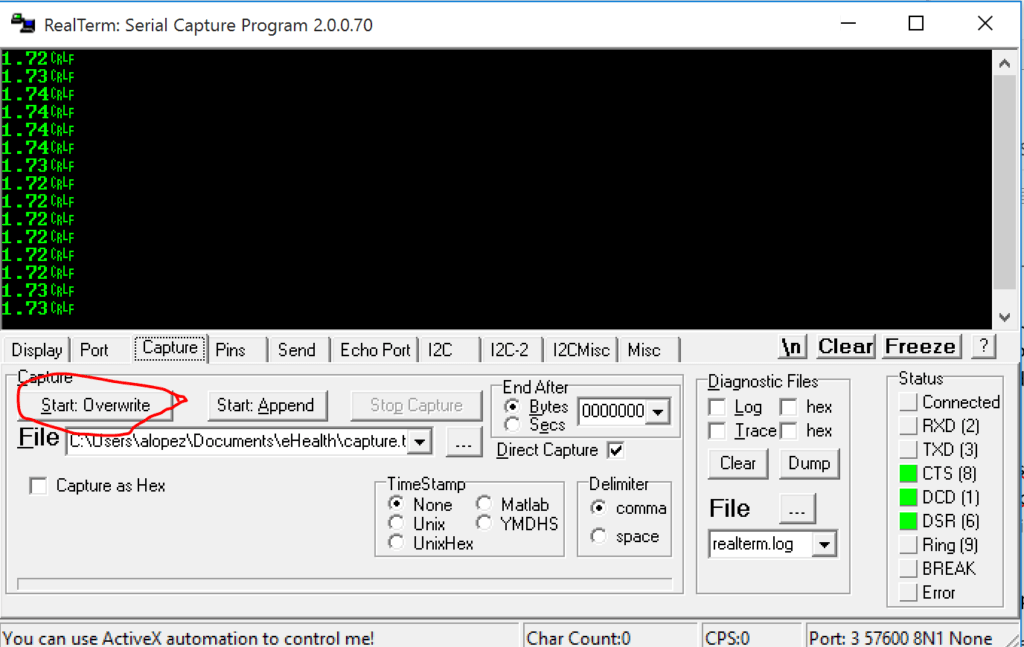
4. Configure the CSV data writter. On the tab “Capture” of RealTerm, now select or create a new file to write the data and check the “Direct capture” box.


5. Start writing. Once your Arduino is already streaming data to the serial port, go to the tab “Capture” and push “Start: “Overwrite” or “append”, depending if you want to overwrite or append the new data.
To print your data “cleanly” from your Arduino. Print the data without text, for example:
Serial.println(dato);
If you need to plot multiple data simultaneously, you should separate them with a tab, comma or something similar.

While Realterm is writing to the file, the GUI should appear in red colour.
2- Plot the data stored on the CSV file in a Graph
Once we have already set up the realTerm terminal and it is writting continuously the coming data from the serial port of Arduino into the CSV file.
Let’s continue with the second step!
1. Download the free and open source kst program (available to all the platforms: Windows, Mac and Linux). Follow the instructions to complete the instalation.
2. Execute the program.
3. Open the data wizard and go through, as it is explained on the following pictures:

4. Open the data wizard and follow the steps. You have to select the previous CSV file as the source file. Choose the option -time interval: “change detection” if you are working with real-time data.
If you want to reproduce a saved test, just select “no update”. Important to change the ASCII file configuration.

5. ASCII configuration. Here you have to say to the program how to interpret the file. This configuration depends on your CSV file and how you printed the data from the Arduino.
The most important parameters are selected with red.

6. Select your which data you want to plot.
If your file has a header on the first row with the field names and you have selected “Read field names from line” on the previous step, now you should see the names. If not, you will see “column 1″, Column 2”, etc…
Kst always generates an automatic column called INDEX, which is the numbers 0, 1, 2, 3… useful to use on the x-axis.
Select all the columns you want to plot on the correct order and press next.
7. Data range.
Usually, you want to plot real-time data, so you want to show the last X samples available in your file. For this you have to choose “count from end” and set the range between 200 and 500 depending on how fast you read the data or how fast your CSV file is updated. This can be changed later.
I recommend you to choose the INDEX column on the X-axis.
8. Layout configuration.
Leave this as default and later you can change what you like from the kst graph window.
Here I like to remove the legends of each plot to have a better view. This only makes sense if you plot more than one curve per graph.
The final plot with one variable will look like the following pic:

If you had multiple signals, the view with more plots looks…
After changing your visualisation, parameters, etc you can save the configuration as a *.kst file. You will save many time for the next time by opening directly this config file!!
For Linux users:
You have to call the following command to open the kst GUI:
kst2
Also is possible to automatize and embed kst in a python script.
You must call kst from python:
import subprocess

....

subprocess.Popen[("kst2")] #open the real time plotter
If you want to open kst with a saved configuration file, which have to be in the root folder:
import subprocess

....

subprocess.Popen[("kst2", "myKSTfile.kst")] #open the real time plotter
I hope this was useful to you.
If you have any questions or suggestions, let me know in the comments below


Hi! I don’t know the limits about this. The question is that I need to plot signal that its coming at 400 samples per second or 200 samples per second if its need it. So this is going to be fast enough. Other project I try with matlab was to slow for this. Also the data send it it sendit by bytes so it would get together again. So to sum up, this project could be adapt for this conditions, in this case I would try it. Sorry for my english Greetings from Spain.
Hello Arnau, In this case you mention, should work fine. The KST is able to plot even faster (depend on the machine… but yes). Just in case set the serial communicacion of the Arduino to the maximum possible. Maybe 115200 kps is enough. You can use Realterm or oder program to write the data into a file.
Regards
Saludos desde Murcia!
i am attempting to use this software for a school project and am very new to Arduinos and programming i tried following your steps but when my data is running on real term it is not in numbers it is some symbol that the best way i can describe it is ()E repeated over and over is there a way to change that into a usable number? any help is greatly appreciated and thank you for the great site!
It seems, maybe you should change the speed of receiving on the realterm to match the same rate speed configured on the arduino
Best Regards and luck! 🙂
Congrats! excellent trick! Thanks!
Hola Alberto.
Te felicito por el artículo. Lo tienes en español? Para evitar malos entendidos.
Gracias
Hola Joaquín,
no, toda la documentación de este tipo la escribo directamente en inglés.
Saludos
Hola Alberto! Que tal? Pedro, desde Braga, Portugal.
Great job! Very easy and straight forward explanation.
There is only 1 little thing i wanted to ask you: this solution is only for reading pre-stored csv files or it KST can also read straight in real-time from COM port being written by ESP32, in my case?
Yes, you can read straight from the serial port 😉
Can I display real time graph from vibration sensor data via arduino?
Yes,
You can make with RealTerm or directly with the new Arduino IDE using the built real time plotter.
Best Regards
Hello,
First of all, thank you very much for this very useful post.
In order to send data to the serial port all you have to do is use serial.print() or serial.printIn()
Exactly!!
When I try to capture as you did in step 5 it tells me that port must be open to capture. Even though the data my Arduino is streaming is being displayed on the real-term screen it is just giving me an error when I try to capture.
Hello Mohammed,
Are you sure that the port is not being used at the same time for other program? Is the port well setup?
Regards
Alberto
I am getting a UART receiver framing error when capturing the data like you. is there a reason for this?
Hello Mathew,
I would need more information